Improving Financial Decision-Making with Data Visualization

greatnext
A cloud-based solution to book your next adventure.
May 5, 2023
edetailing-banner
Edetailing Engagement
March 14, 2023
finance

A financial company wanted to improve the way it made business decisions by using data visualization to better understand and analyze its data. The company was looking for a tool that was easy to use and could handle large amounts of data.

_ PROBLEM AREAS

Challenge to pinpoint exact issues with multiple systems in place.

  • With Service Now implemented the employees were reporting issues and raising tickets.
  • With Control Up the performance of employees’ machines and applications were tracked, but there was no way to pinpoint the exact issue and present this information to application and platform owners in easy to understand format.
  • With daily over 300 xls files generated it was close to impossible to go through each file and find out relevant issues.
_ SOLUTION

Vistaar was engaged to visualize and analyze data.

Power BI is a cloud-based business analytics service that enables users to visualize and analyze data with dashboards and reports. Power BI was used to create interactive dashboards and reports that displayed key performance indicators (KPIs) and other relevant data. The dashboards and reports were customized to meet the specific needs of different teams within the company, such as the IT team, the application owners team, and the support team. Python was used to process the generated xls files and push the data to SQL Server.
0 +
KPIs identified
0 +
Apps/Services analyzed
_ RESULTS

Improved operational efficiency, helps in taking performance driven business decisions.

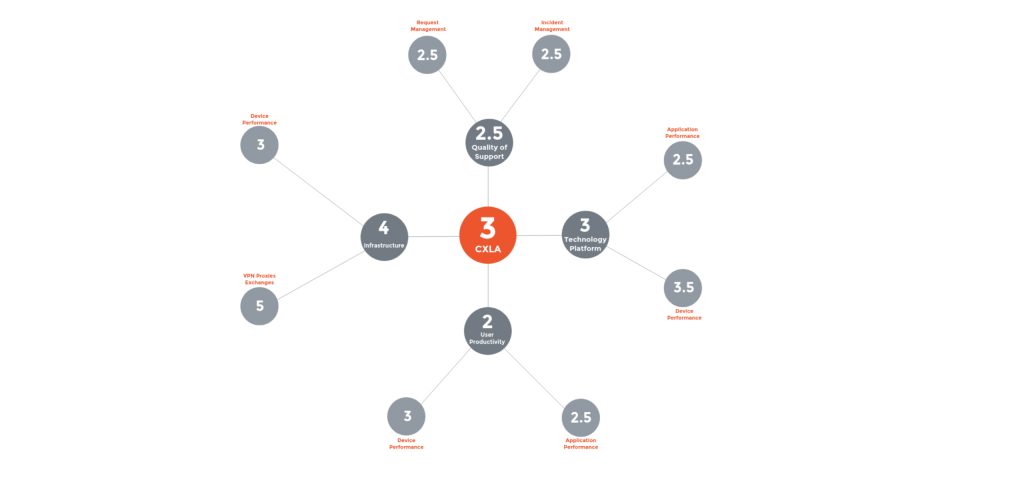
The implementation of Power BI had a significant impact on the financial company’s ability to make informed business decisions. The interactive dashboards and reports provided a clear and visual representation of the company’s data, which made it easier for teams to understand and analyze the information. The ability to connect to multiple data sources also helped to improve data accuracy and completeness, as it allowed the company to have a more comprehensive view of its operations. Overall, the use of data visualization with Power BI enabled the financial company to make more informed and effective business decisions, leading to improved performance and increased efficiency.